Blog
Blog
Trading Strategy Optimization – how it’s done and does…
Strategy optimization is a very controversial topic… Just talking about backtests or automated trading algorithms starts ticking people off left and right. But then you mention that you also optimize those algorithms and then just hold on to your hat! You will hear all sorts of things about how backtested and automated trading algorithms don’t work. And if yours manages to make money… pfft… you’re just getting lucky now. Regardless… I wanna talk about strategy optimization. Explain to you why it works, how it’s done and what you should avoid when optimizing your strategy.
Don’t like reading? Watch the video instead!
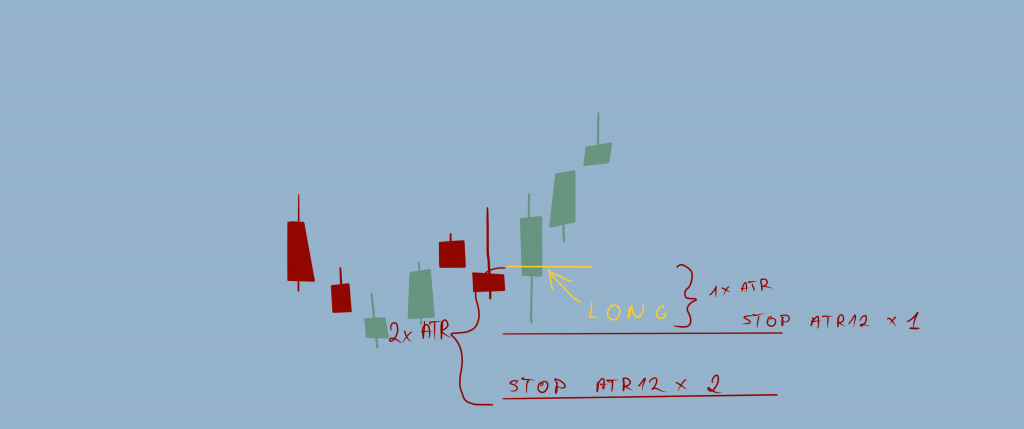
Now before we start we need to establish what am I talking about when I say strategy optimization. I am referring to finding optimal parameter values for certain variables in your strategy. For example. If you set your stop based on the value of an average true range. What multiple of the ATR do you use? Half? Single ATR? Double ATR? Or what period of said ATR gives the most optimal results? ATR5? 12? ATR50? What combination of these values means the least amount of fake stop-outs? What value brings the best performance? Remember too narrow stops might mean too many fake stop-outs, while too wide stops might just have you stay in the trade too long after it has really reversed… And this does not only go for stop sizes. Pretty much anything that could have a variable value in your strategy can be optimized. A moving average period, a channel width, breakout margin and so on… So we will be talking about parameter value optimization. What I am not referring to when saying optimization is overfitting your strategy to improve the backtest results by introducing more variables, more conditions, and most importantly more isolated conditions that only enact a few times in your backtest causing it to have null statistical validity.
So NOT talking about curve fitting here. That’s a whole different subject I’ll have to cover in a future post.
Alright now that we know what exactly is strategy optimization – let’s see why and how optimizing your strategy works and why it’s better than not optimizing. Let’s take the stop example from before. Imagine we want to optimize a strategy that uses a multiple of ATR12 stop size. And we want to optimize the amount of ATR we use for the stop.
How this looks is you plot the backtest performance for different ATR multiple values on a chart. This chart ends up looking something like this.

Note the peak. This is the multiple value of stops that yield the best backtest returns value. Now obviously we understand that live market conditions will not match the backtest. When you go live things will shift. This shift will move this chart one way or another to a certain degree.

So you will no longer be using the optimal value. If you were to backtest these new market conditions you would see that the optimal value has shifted. BUT what’s important is that when you shift from the peak left or right, you will always get worse results, but those results will be still better than non-optimized results. Imagine this is the value you started with without optimization. Clearly when you go live the results might shift for better or for worse depending which way the chart would move. And this is the optimal value. It will always yield worse results. BUT even in the best-case scenario, the non-optimized shift will still yield worse performance than the optimized value will even after shifting to worse after going live.

Now that we have an idea of why it is worth optimizing let’s talk about THE HOW.
How is this optimization performed? Well, it’s pretty simple actually. Your strategy is backtested several times each time changing the value you are optimizing. This will give you a number of data points for each backtest performance measurement as you saw in the previous example. You then plot that selected measurement on a chart and you get this curve.
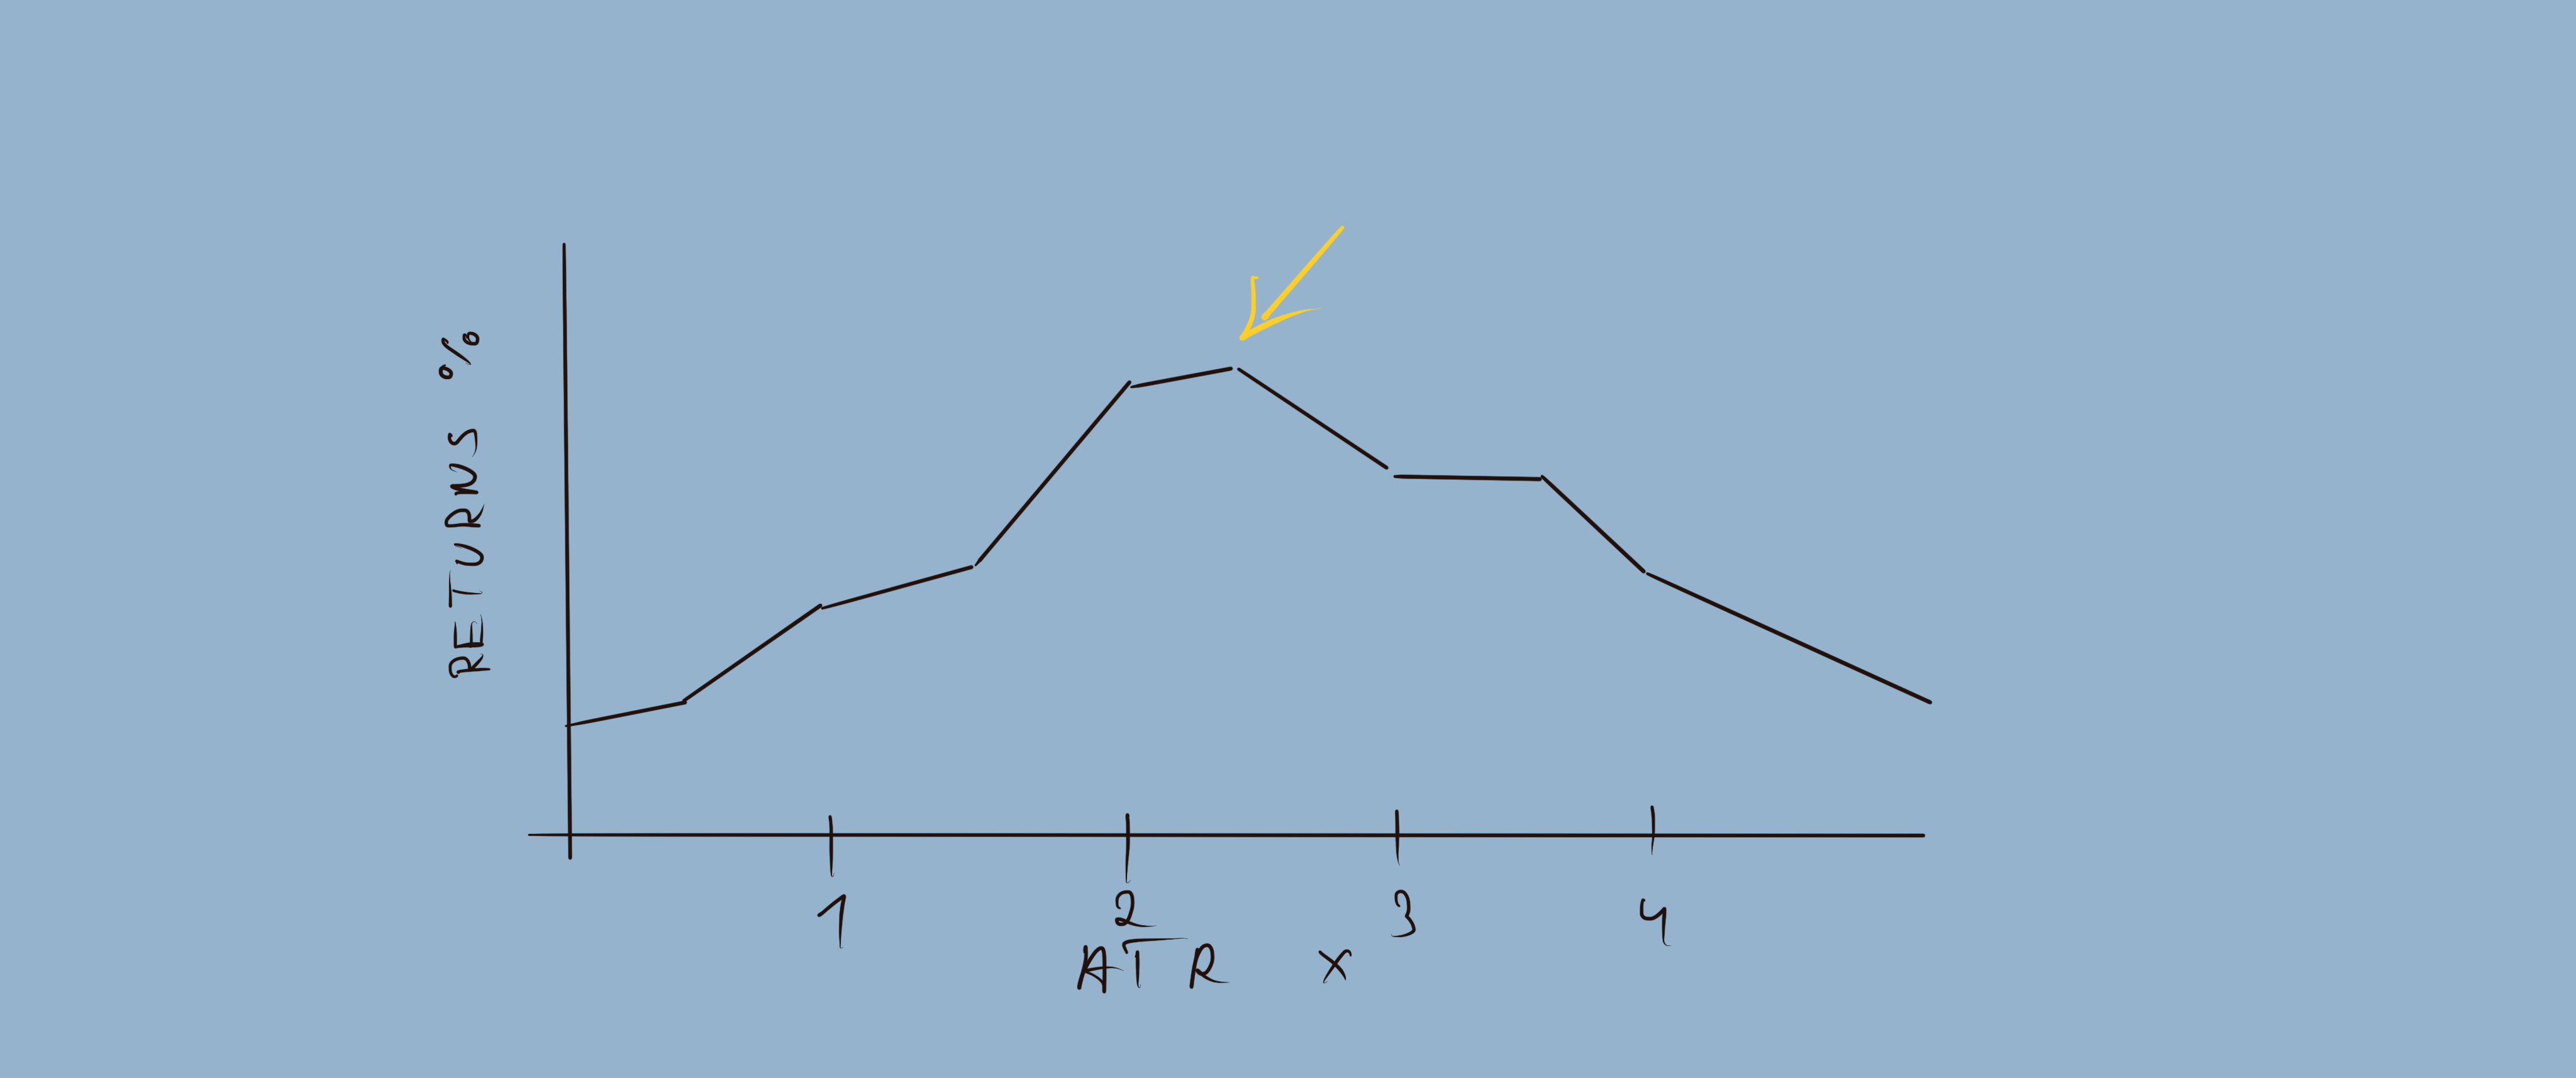
Now after getting this chart what we wanna look for peak values. 80% of the time if everything is performed correctly you will be getting a single peak that looks something like above and data going down from it. That peak value is the optimal value to give the best result that you are plotting. Now a very important thing to note is that we also have to make sure we are evaluating the correct performance measurement to find said optimal value. Imagine you just look at the % returns and find that this value is the optimal value to give the best returns. Well, what you don’t know is that this value might increase your maximum drawdown several times compared to every other value.


So a pro tip here would be to plot a value that accounts for both performance and drawdown. Something like a Sharpe ratio or a MAR value. Or just a simple ratio of returns versus maximum drawdown. What I like to look at and what I have my software plot are MAR value since that accounts for returns versus drawdown and the number of trades and winning/losing trades percentages. This way I can find the best performance value while accounting for risk AND see if my data set size did not suffer significantly to get those results. Also, see if the ratio of winners/losers didn’t change too drastically telling me that the statistical validity of things does not vary too much between optimized parameter values.
And finally some tips on what to avoid. AT ALL COSTS avoid sacrificing statistical validity for better results. If you see that a certain value gives a significantly smaller dataset of trades to evaluate the performance it is in 99 percent of the cases better to ignore this value even if it gives significantly better performance results. Remember, we are scientists here, we use statistics and we play the numbers game. For us to win at this numbers game our statistics need to be valid. Hence a larger data set is always more preferable than better results. Just because you will be able to trust those statistics, especially when it comes to drawdown periods. You might start doubting yourself and your algorithm when things go south for long enough. But if you know that your statistics are valid, were performed on a large and diverse enough dataset and they tell you things are gonna be alright in the end you will have a lot easier time trusting that than if you had great backtest results but you only had like 15 trades to account for. You will definitely start doubting if it was just luck that gave you the good results in such a case.
So there you go. That’s how strategies are optimized. Now if you want to have a piece of software like this that can optimize your strategy in such a way – head over to Diamond Strategies website and contact me to get a piece just for you. Of course, you will need your strategy automated and backtested to even have such optimization as a possibility – but no worries, me and my team can take care of that for you. Anyhow, I always hate promoting things, I just feel it chips away at my credibility but this is not some sponsored thing I am telling you about, I really believe this is the best thing you can do for your trading and I just want to make it available for everyone. I feel like these possibilities were limited to a certain group of people and I want that to change. That’s why I have worked for years to get this ready for the public and that’s why the prices are so acceptable for traders. For a price of what it would cost you to lose a few trades you can get your strategy automated, tested and optimized. In the long run, it just seems so worth it.
Ok, this probably dragged on for more than it should have. Anyhow. I do hope you learned something. As always – if you want to join the community of people who trade using science subscribe to the Statistical Trader YouTube channel to always be in the loop with new content coming out.